Loading Phoenix ML...
Loading Phoenix ML...

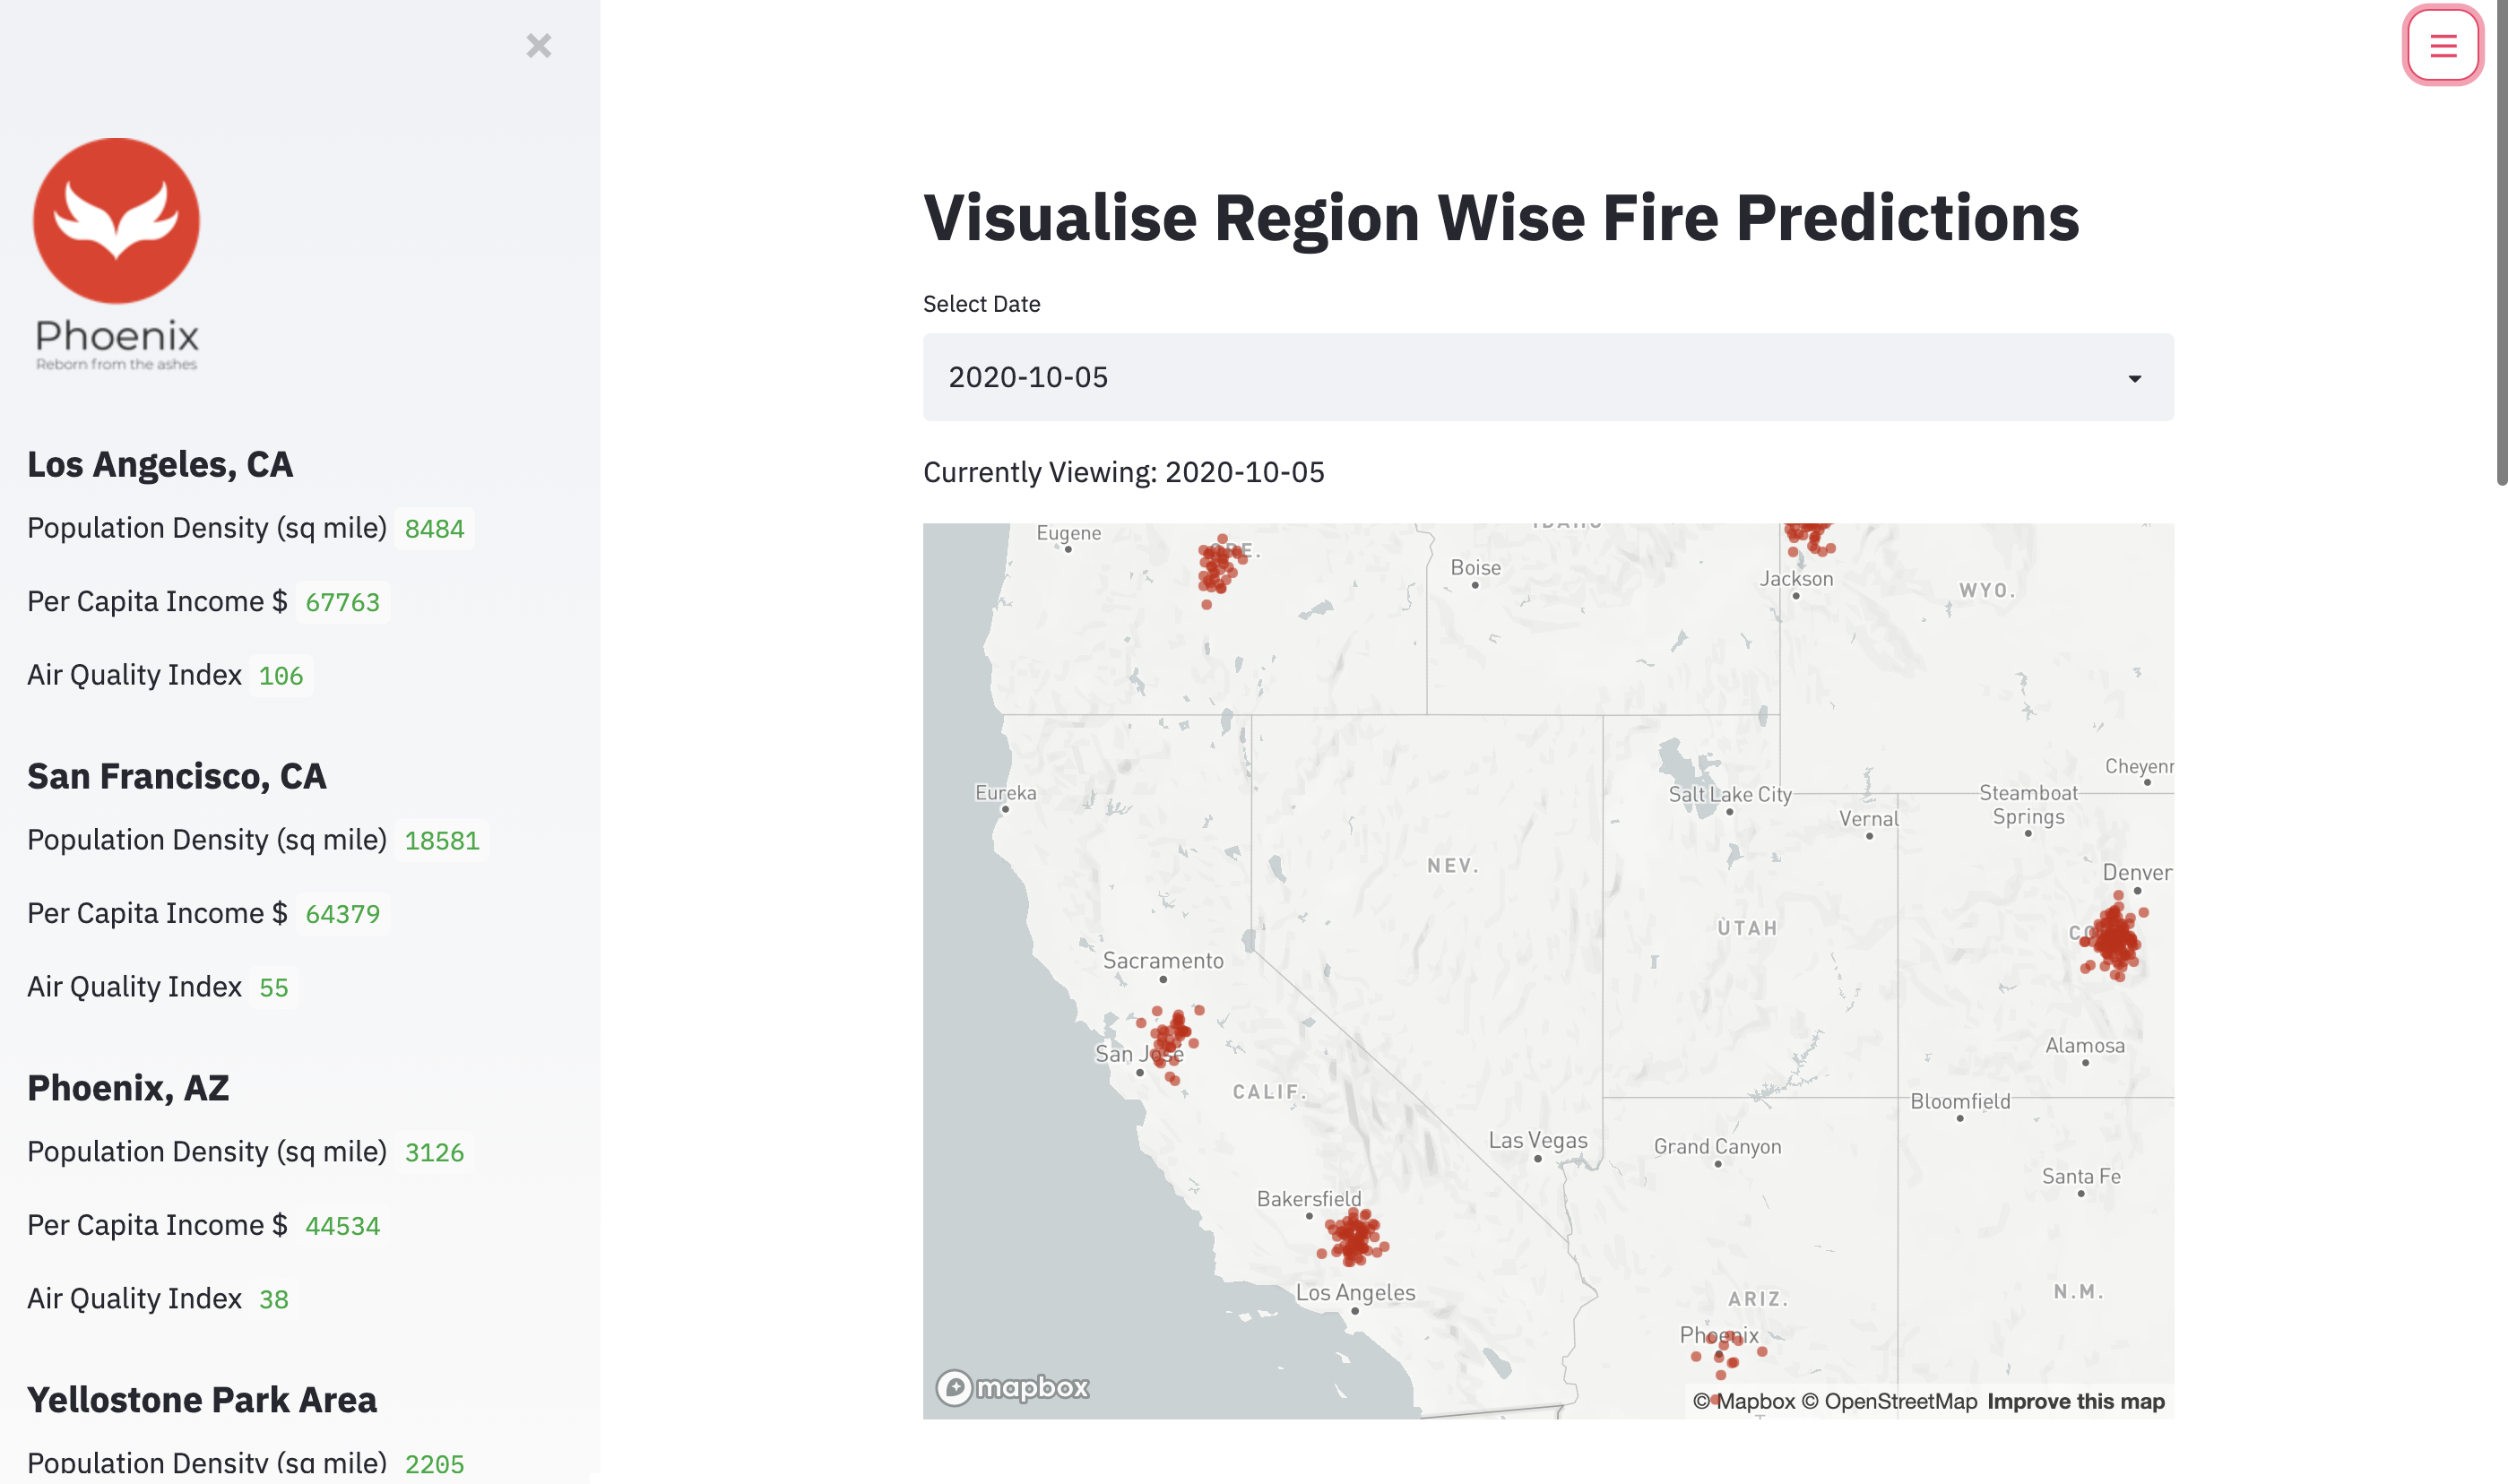
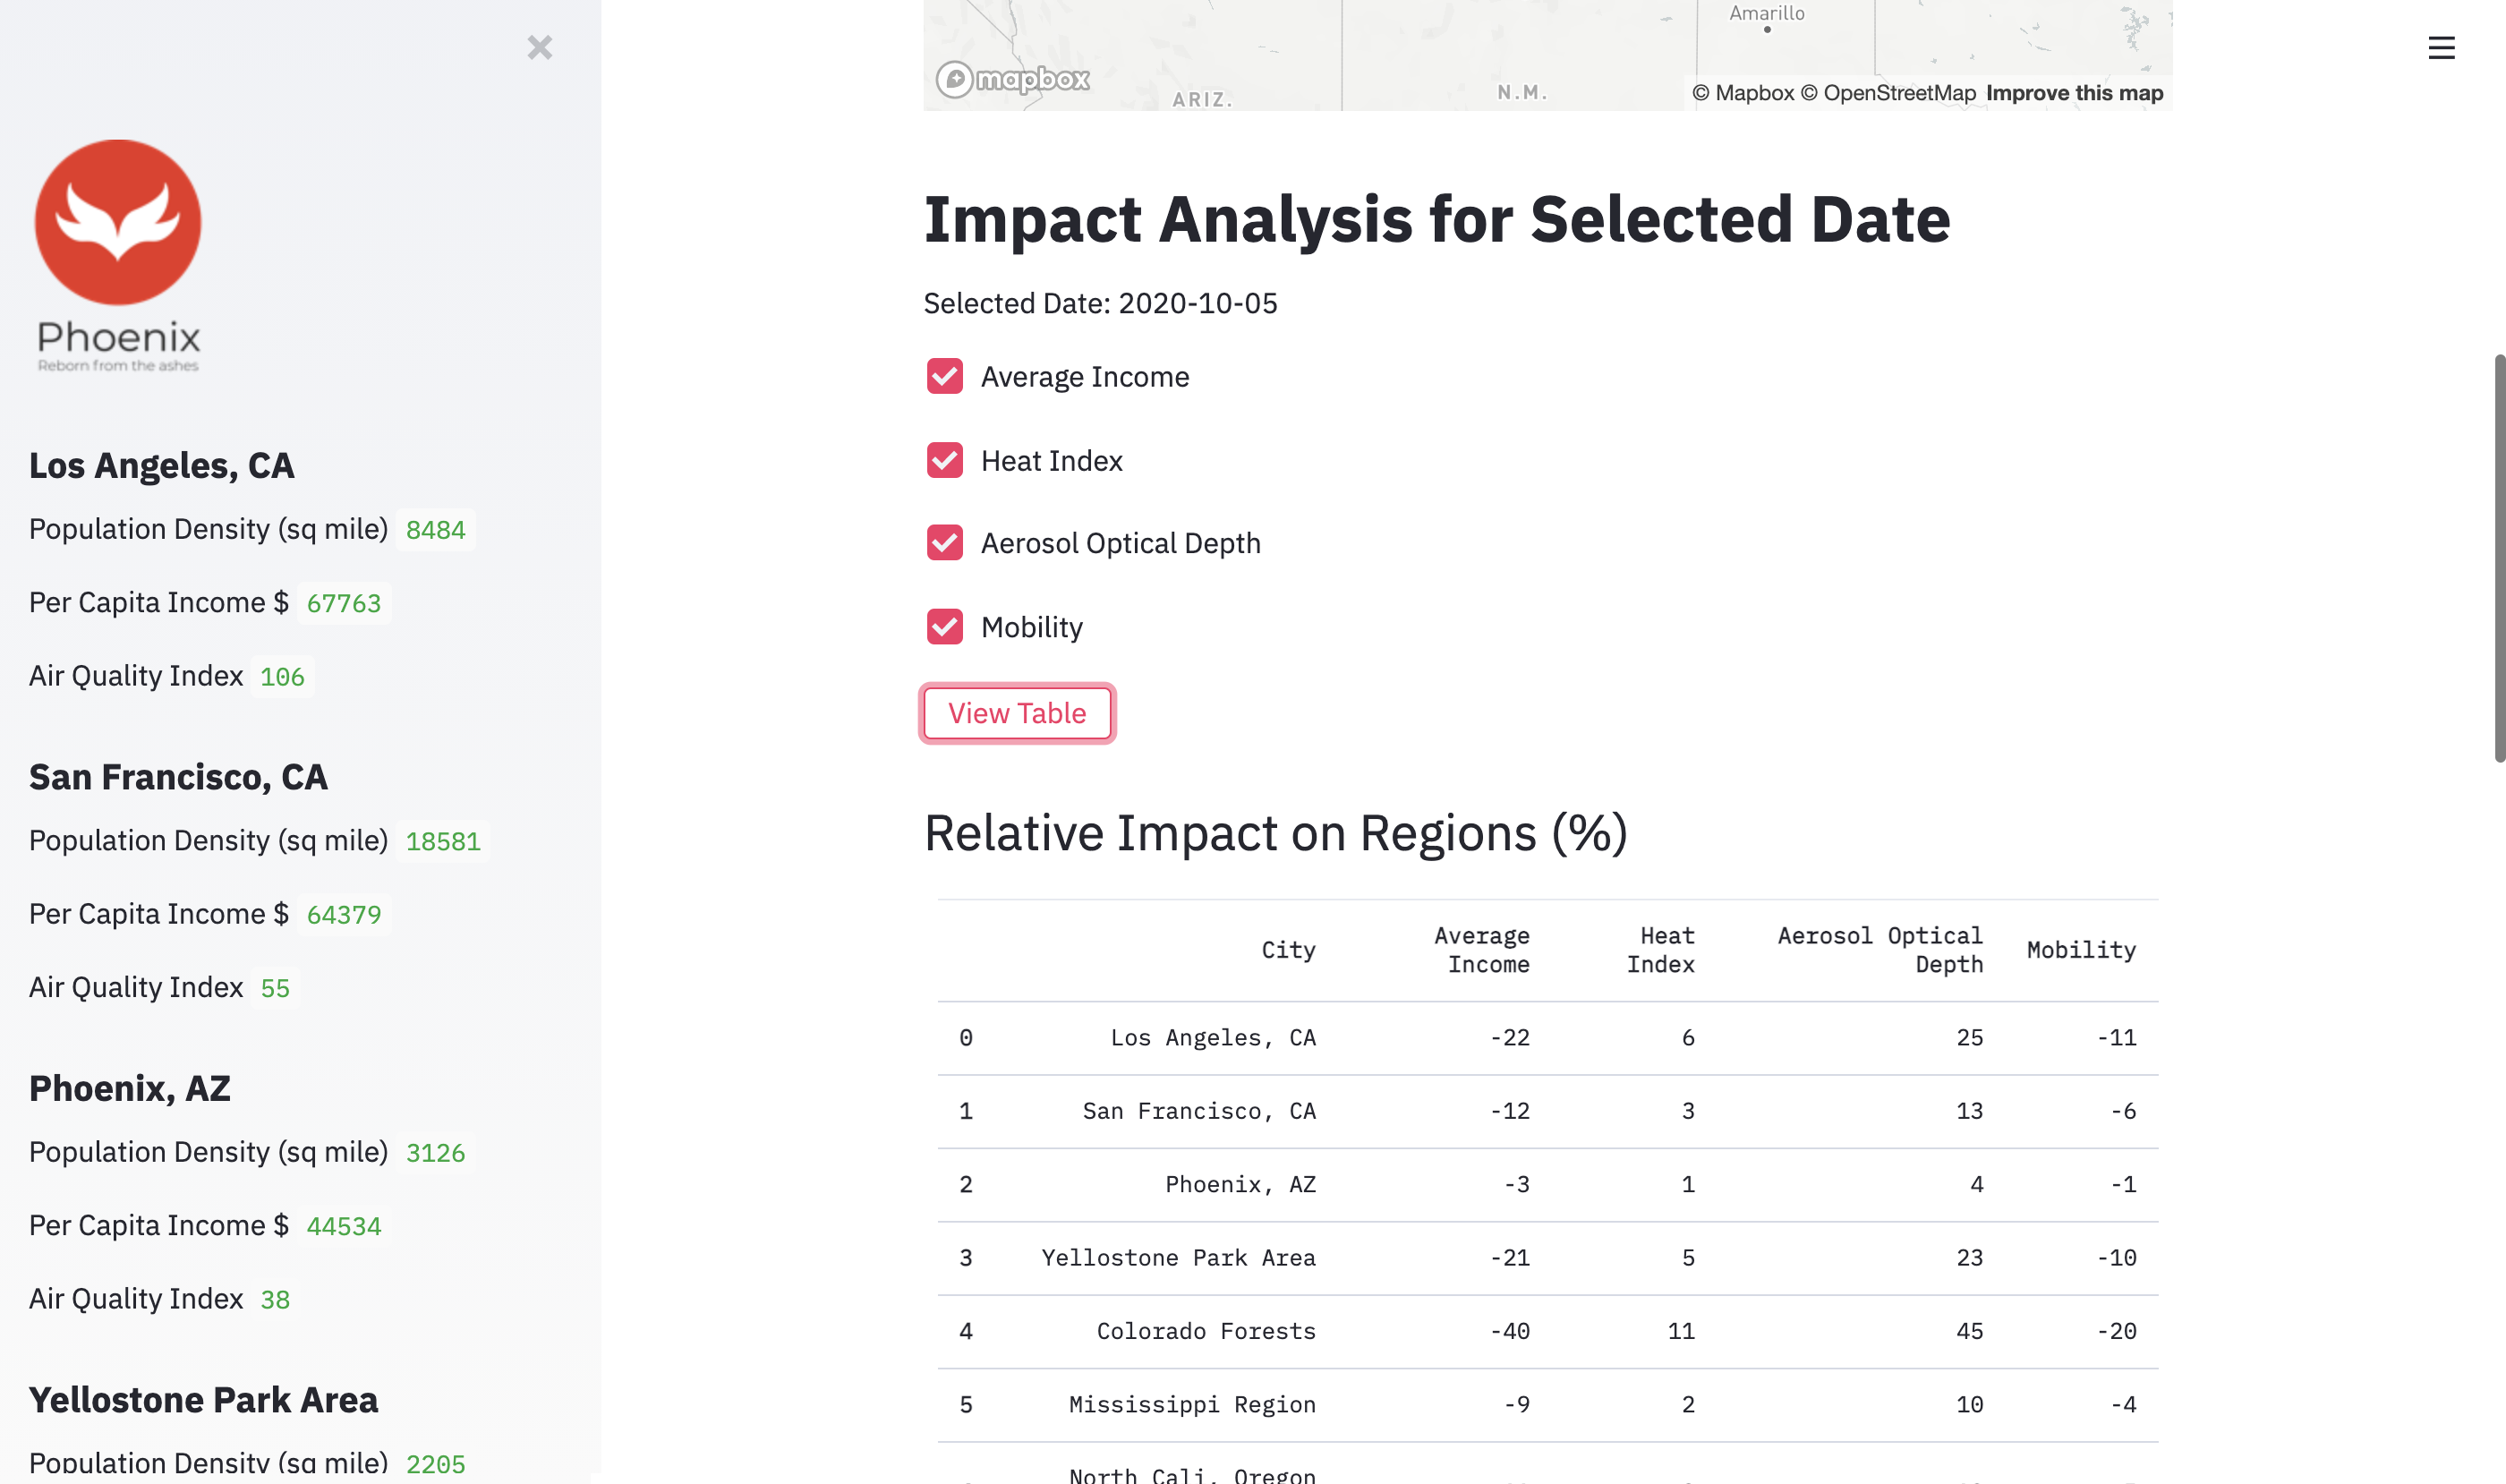
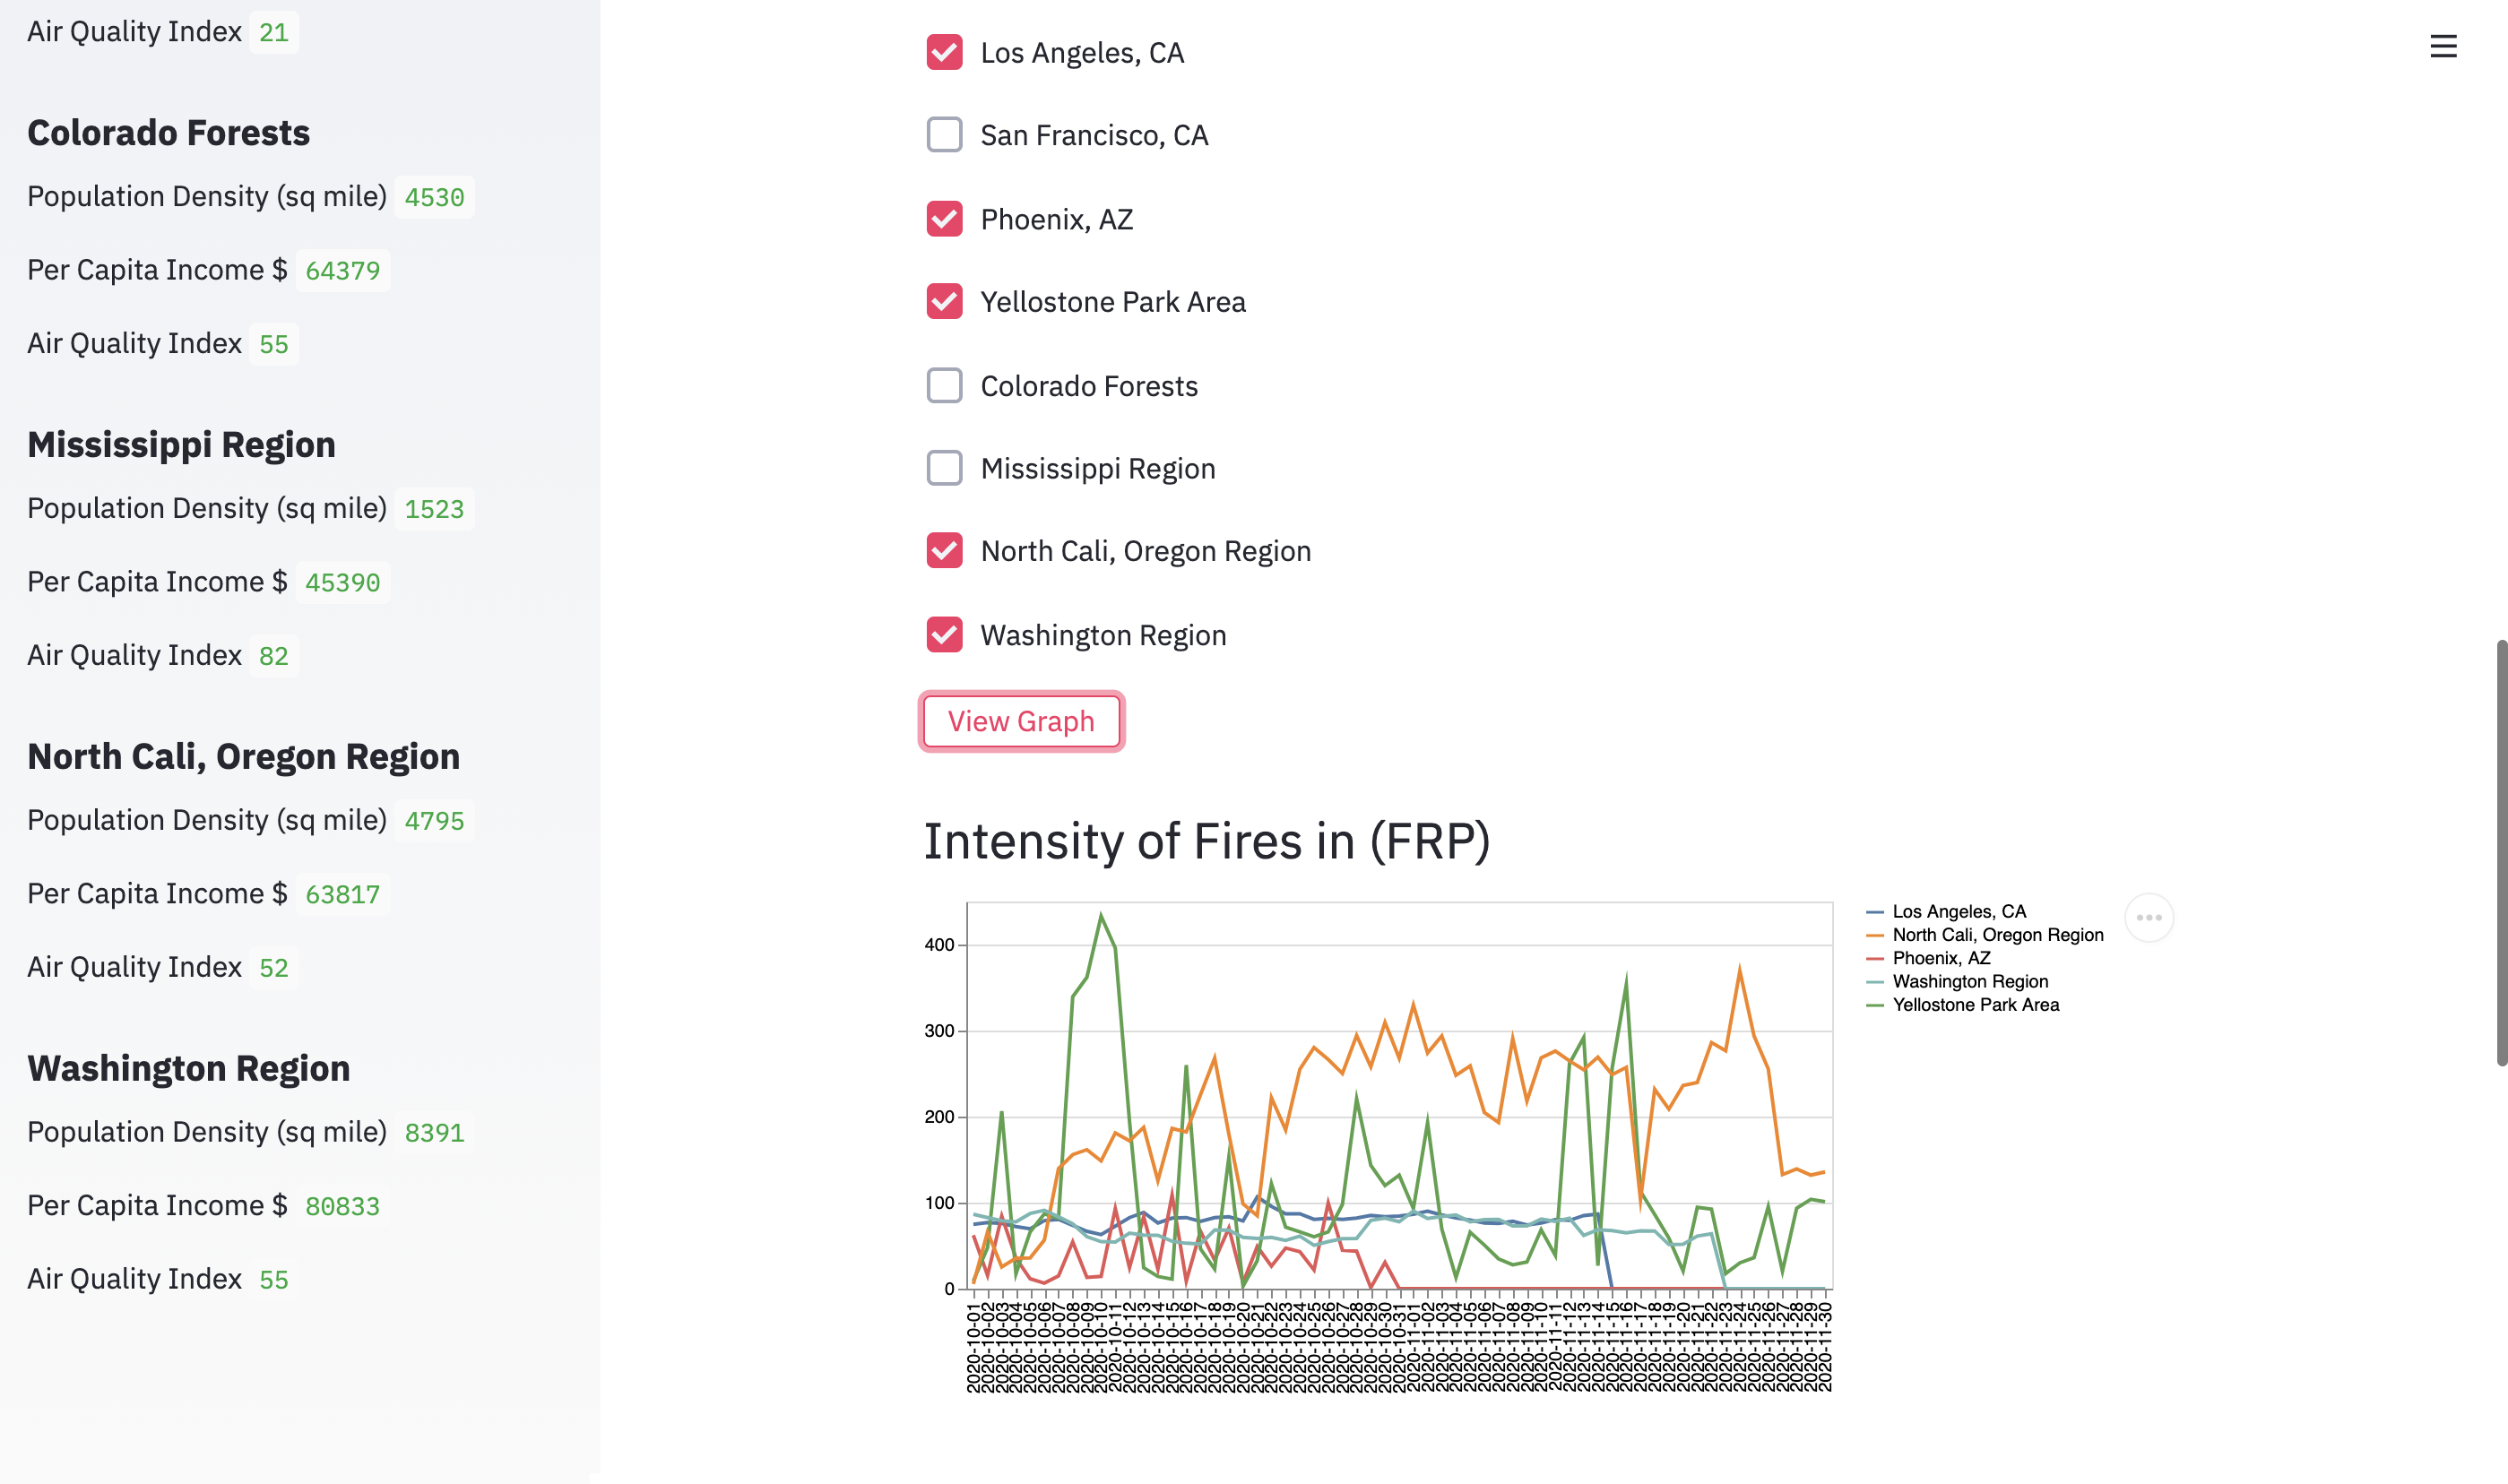
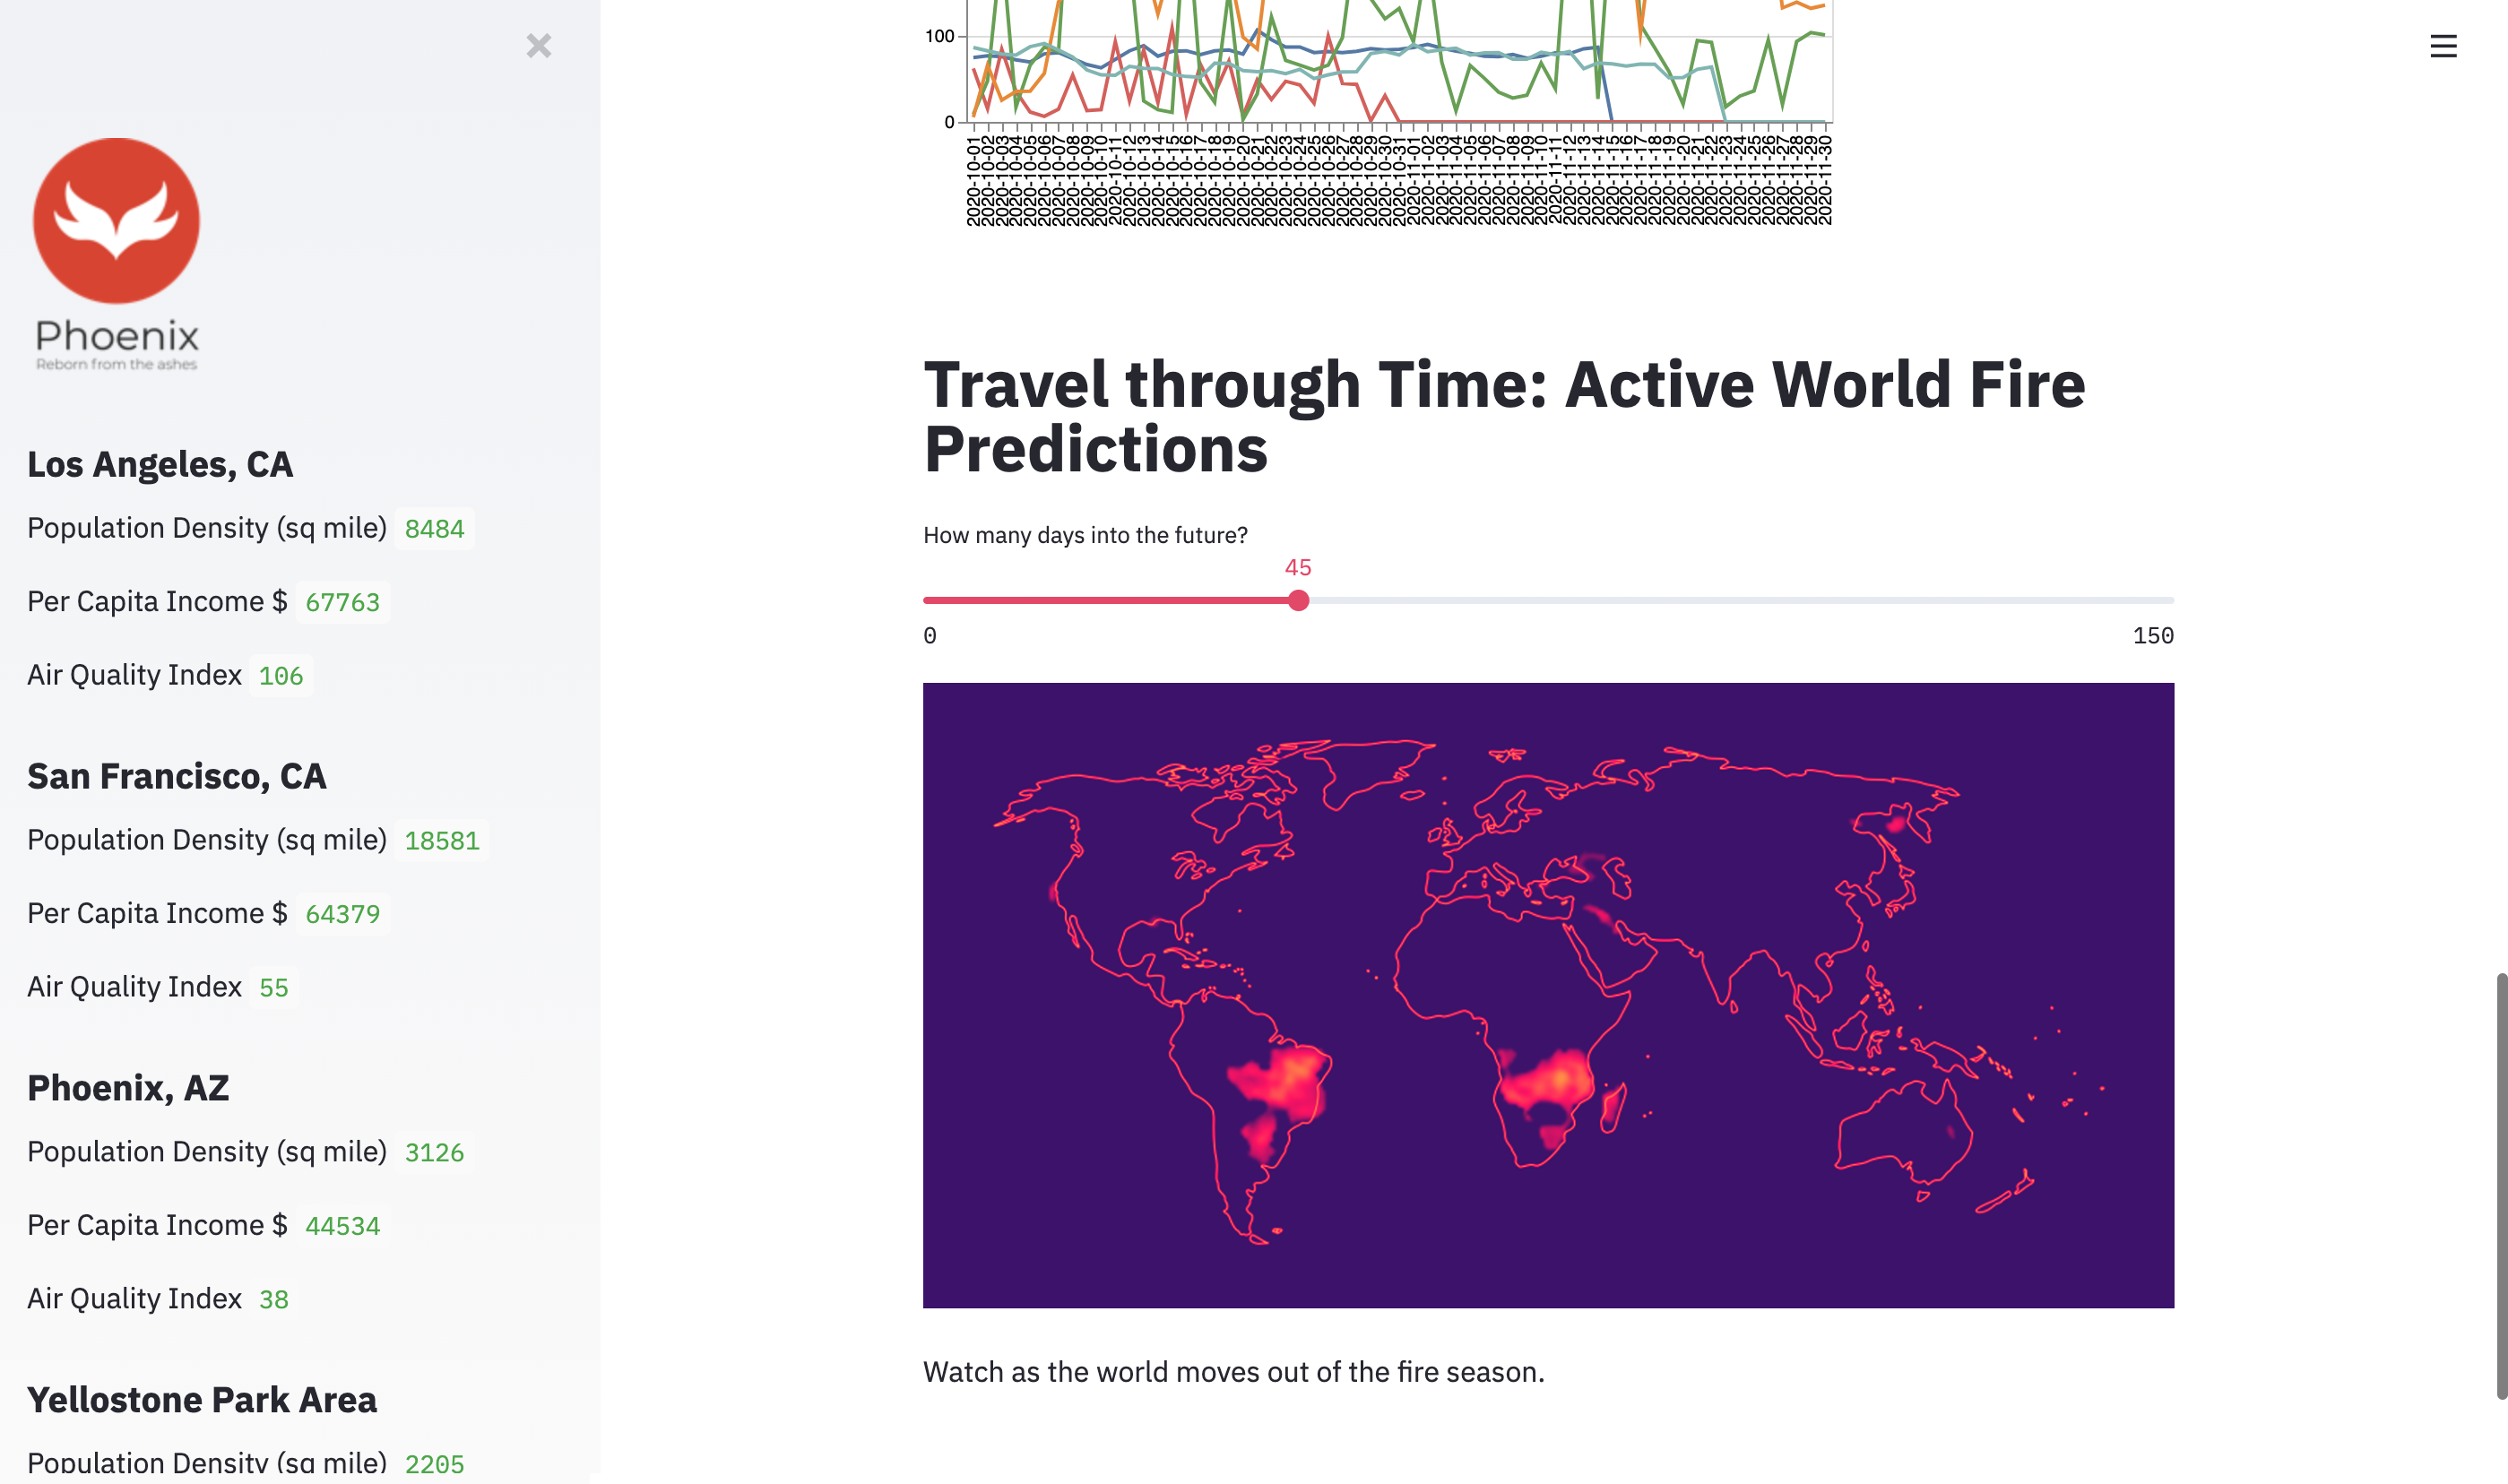
Impact Analysis for Selected Date, Compare Fire Intensity, Intensity of Fires in (FRP), Travel through Time: Active World Fire Predictions [https://phoenix-ml.herokuapp.com].
We built a platform to provide actionable insights to government agencies and social workers to help them understand the impact of fires, and see past and forecasted fire tracks to be better able to allocate resources. We talked to some of these social workers to understand what would be most helpful and used their inputs to frame our problem statement. Our product, Phoenix, is an intuitive easy-to-use open-source dashboard equipped with a number of novel machine learning and deep learning models to ingest data in real-time. We utilised a plethora of different types of data, ranging from biodiversity datasets to per capita income data in order to measure and predict the impact of wildfires in a particular region. The main source of data was NASA’s Archival and Active Fire data taken from the FIRMS repository. We used time series analysis and looked at the model weights to understand how each of these socio-economic factors was being impacted by the fires. For the government agencies to triage, this brings them golden insights to focus on fires which are expected to have the worst impact on factors like mobility, economic impact, heat-index, and regional climate. We developed our own novel deep learning model using Keras in Python. We then trained a multilayer Convolutional Neural Network and made a prediction of the brightness of fires in each location in the world in the following week. We merged together datasets that others hadn’t done before by transforming the data in a consistent format.
Forest fires have always caused a major impact on the environment and economy. Our product uses a combination of Machine Learning techniques including Convolutional Neural Network and Regressions to predict future wildfires and estimate the economic impact that can be caused by it. By predicting future wildfires, appropriate fire mitigation methods can be taken by the concerned authorities and measures can be taken to minimize the damage caused by wildfires.
1) Interactivity: We made this the key focus of our project. There exist a lot of separate datasets with nuggets of information that could be useful but they weren’t accessible. We used SteamLit to create interactive visualizations of socio-economic impact, and predictions of fire spread across the world that anyone can interact with easily. Users can filter by date, look at particular locations, and even compare how the fires impact some of the top cities in the US.
2) Predictions: The city and federal governments need to allocate resources to these fires, and this needs data backing it. How long are these fires going to last? How much impact will society have from this? We looked at past data to see how the fires spread, how they subsided and used Convolutional Neural networks to forecast the fires a week into the future given the current fires in the neighbouring region. Then, we used publicly available data from these regions and saw how they changed due to neighbouring fires. Using this we could build a very rigorous model that can predict future impact in any region given the fires around it, making it an invaluable resource to all the social workers fighting this calamity.
3) Impact Analysis: This we found to be one of the hardest yet the most exciting parts of this challenge. How can we correlate subjective fluctuating variables like mobility and economic output of a region with the fires around it? These are affected by general trends, seasonality, and the external effect of fires. For this we use time series analysis and explainability through looking at the model weights to understand how each of these socio-economic factors was being impacted by the fires. For the government agencies to triage, this brings them golden insights to focus on fires which are expected to have the worst impact on factors like mobility, economic impact, heat index, and regional climate.
As a team, we saw a lot of potential in reducing the environmental and economic impact caused by the wildfires.
We first did a literary review to understand what were core factors that caused fires, increased their spread, and what metrics were most impacted. We realized that the most valuable insights we can provide are those that reflect the socio-economic impact and the forecasted spread of fires in a manner that is both intuitive to understand and actionable.
We first did a region-wise analysis of 8 cities in the US which are metropolitan areas most prone to fires. We predicted the fire intensities of these in FPR and used MultiVariate regression where we used heat, temperature, wind, precipitation, and soil moisture which are some of the most important indicators of potential fires. We used our predictions to calculate the impact on socio-economic and environmental factors like Average Income, Mobility, and the amount of aerosol particles (eg. smoke, dust release). These are factors that are most important to consider for government agencies when they are deciding how to allocate resources to fight fires which have been reaching uncontrollable levels in the last few years.
We developed our own novel deep learning model using Keras (on Tensorflow) in Python. We took as input an image of the fires marked by intensity all over the world, represented as pixel brightness in images with dimension 3600x1800. We preprocessed them by grayscaling, applying normalization and then used a MaxPool with a kernel size of 10 to reduce it down to (180x360). We then trained a multilayer Convolutional Neural Network on it to make a prediction of the brightness of fires in each location in the world in the following week. We trained it with data from 2000-2020 and optimized it using the Adamax optimizer (we found the best learning rate to be 0.005). We experimented with an L1 and MSE loss and realized that given the sparsity of the data, MSE would give us the best results and we trained our model for 1000 epochs.
We trained our machine learning models on Google Colab which had 16GB of RAM and a GPU hardware accelerator. For our data analysis, we used an AWS EC2 instance with 48GB RAM.
The biggest challenge was cleaning the dataset and making it fit to be aggregated. Combining multiple datasets led to challenges of missing data, mistyped fields, and different data formats. For example, some datasets had zipcodes, some had states, others had latitude-longitude values, and some like images had pixels representing fires. We merged together datasets that others hadn’t done before by transforming the data in a consistent format.
We faced a key infrastructure challenge while training on our dataset with 1000x (1800x3600x3) images in such little time with scarce GPU resources. To solve this, we trained our CNN in batches and experimented with using the smallest possible model to both prevent overfitting and make good predictions with a lesser number of trainable parameters.
After considering many options for deployment of our app, the app was finally deployed through the Heroku Framework.
In our project, we utilised a plethora of different types of data, ranging from biodiversity datasets to per capita income data in order to measure and predict the impact of wildfires in a particular region. The main source of data,however, was NASA’s Archival and Active Fire data taken from FIRMS (Fire Information for Resource Management System) repository. Archival data was obtained from the start of the Fire Season (March) in 2015 till 30 September 2020 for the land area of the Contiguous United States that was recorded by the MODIS satellite. We also included the Active Fire Data by FIRMS of the last 7 days and using this dataset as part of our test-data set was very effective. The data collected also included recordings of the Californian Fires of 2020 (worst ever recorded) and proved to be a quality feature for subsequent fire prediction per date in the whole of the US (especially California). We also used image data for the predictions and impact of the worldwide active fires. We used factors such as vegetation, aerosol, water vapour, rainfall and land surface temperature to drive our predictions. We also analysed the impact of these predictions on the global and national economies as well as social features. We used night time lights and gas emissions to determine region-wise development and effects. We used natural features such as rainfall and soil moisture to calculate impact on the natural features of the problem.